Frameless version of this page
On the evening of September 22, 2007 at about 19h46 UTC the earthmoon grazed and occulted the star ZC 3009 = SAO 189502, assigned to spectralclass F5. The star in a distance of around 165 lightyears shines 2.3 times brighter as our sun does and the visuell brightness is +7.4mag. The waxing moon was lit to 80 percent and his position was 19 degrees above the south horizon.
Earthmoon and star during grazing occultation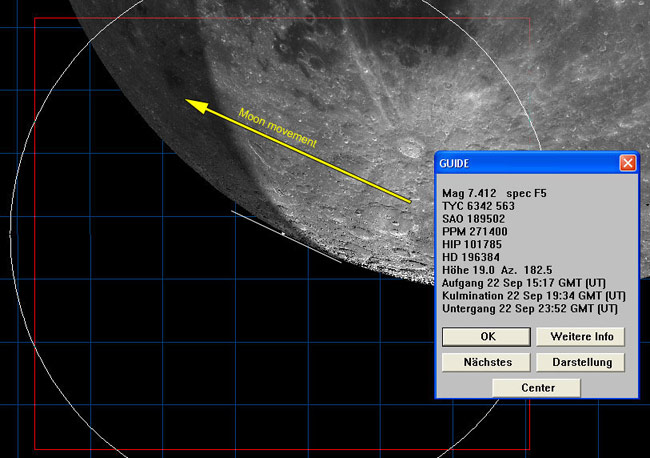
Graphic created with Guide 8 from Bill J Gray.
The procedure from calculation to evaluation
1. Calculation of basic data
The calculation of the basic data for this grazing occultation was done with software Occult3.6 from Dave Herald. With table values of this calculation and software Shadow from Geoff Hitchcox some files for path viewing in Google-Earth and in Google-Map were created. The result was this page with Data and interactive map about event.
2. Selection of observation area
With help of the interactive map an appropriate observation area was selected. The Map A and Satellit image B below shows a part of the path run of this grazing star occultation across Austria and Czech Republic additional the chosen observation point (OP) and the position of my house (Home).
Map A - path run of this grazing star occultation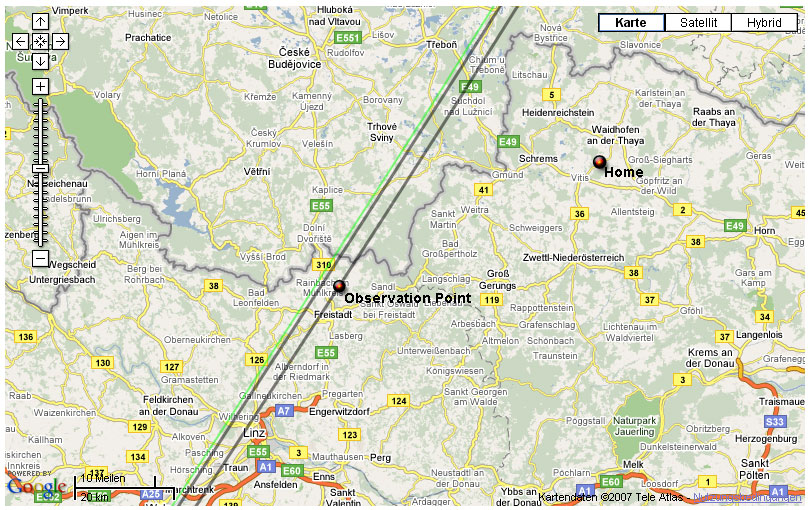
Satellit image B - path run from Austria to Czech Republic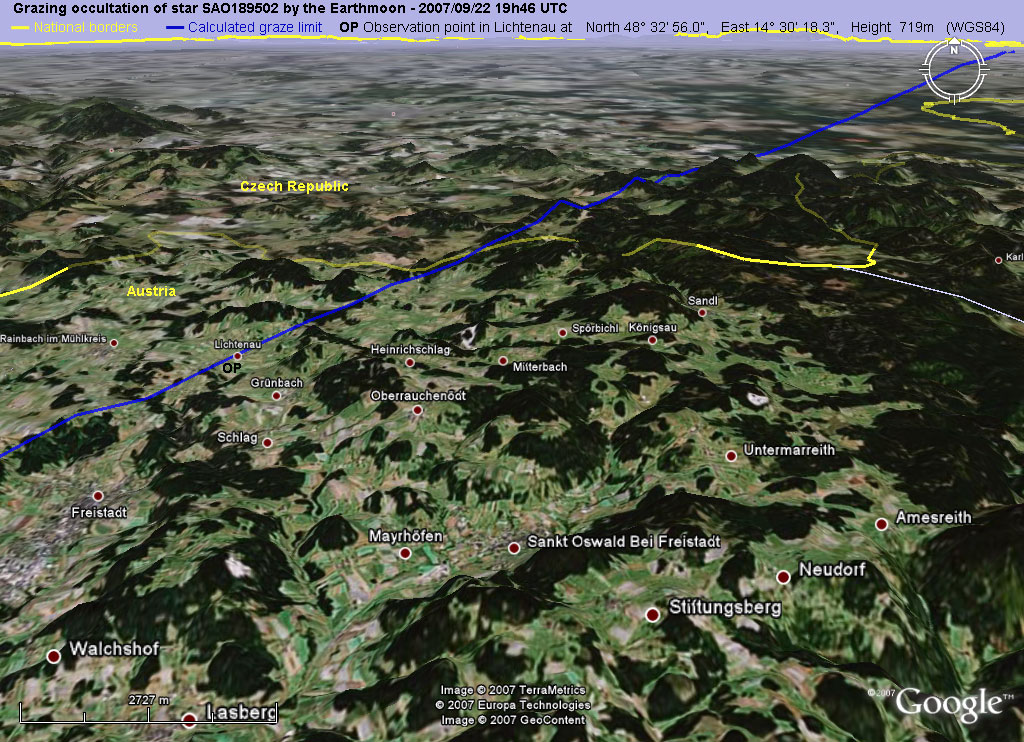
3. Correction of height implementation
As the next step the correction to the right heigh of the chosen observation position was accomplished. In the Map C below one can see a green line on the left side. This green line shows the projection of the idealised moon horizon. The position of this green line is calculated for an also idealised earth surface on sea level (0 meter height). But because the chosen observation area is at a height h of 720 meters (WGS84) all points of this green line are moving by the distance d in direction to the moon and are drawn in a parallel distance X as a new grey line for the height of 720 meters (WGS84).
Map C - calculation and exact observation position OP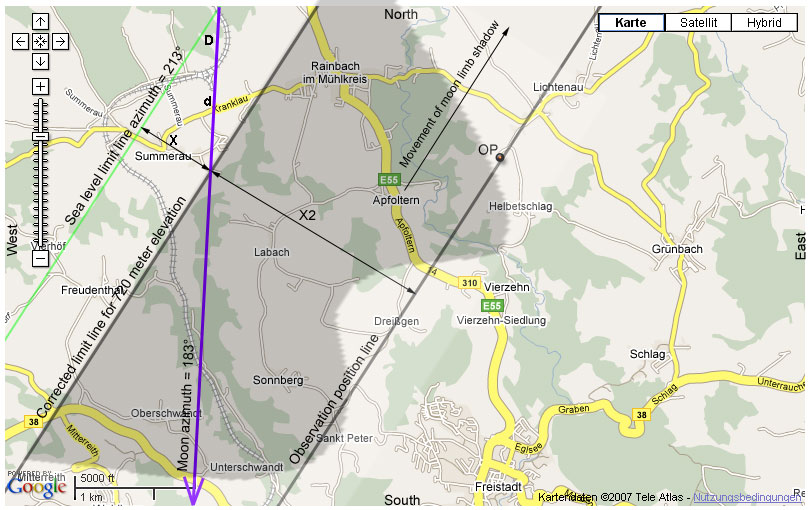
The explanation of this necessary movement d of the projected green moon horizon line in the direction to the moon is shown below by Graphic D. To get the same angle of view from the horizon to the star on a higher observation position the observation position must be moved by the distance d in the direction to the moon. The length of this distance d depends of height h of the observation position and of star elevation angle a above horizon. The parallel distance X of the height corrected grey limit line follows from distance d and the difference azimuth angle D between limit line and moon position. The azimuth angle of the limit line was calculated from pixel coordinates of line ends shown with an image software. The azimuth angle of the moon was calculated by my planetarium software Guide 8 from Bill J Gray.
Calculation operation:  Observation height h = 720m, Star horizon elevation a = 19° at 19h46 UTC

                        Zenith distance z = 90° - a = 90° - 19° = 71°

                        d = h * tan(z) = 720m * 2.904 = 2091m

                        D = Azimuth 213° - Azimuth 183° = 30°

                        X = d * sin(D) = 2091m * 0.5 = 1046m
Graphic D - Height correction of observation position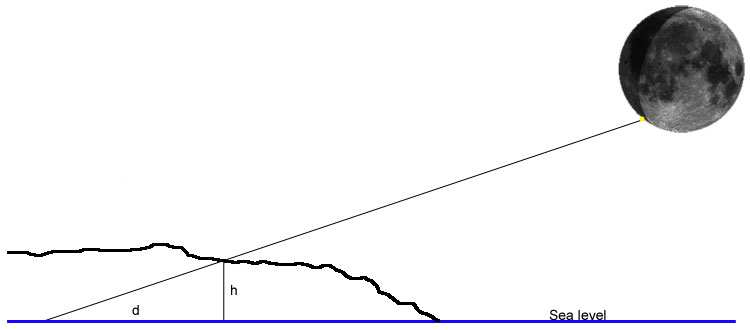
4. Determine observation position with moon profile
As a last step of the calcualtion a good appropriated observation position OP in relative distance X2 = 2950 meters to the limit line was determined with the help of the known moon profile in Graphic E. On this apparent moving level +2950 meters above the ideal moon horizon (limit line) two moon mountain peaks in different heights (+3400m und +3900m) separated by a valley are distinguishable in the moon profile. So the position relative to the limit line was chosen at X2 = 2950 meters to get sure two disappearances and reappearances of the star. Because of this position four high accurate times could be taken describing the moon profile in a height of 2950 meters above the moon ground relative accurate.
Graphic E - the moon limb profile at occultation place
5. Arrival and setup of equipment
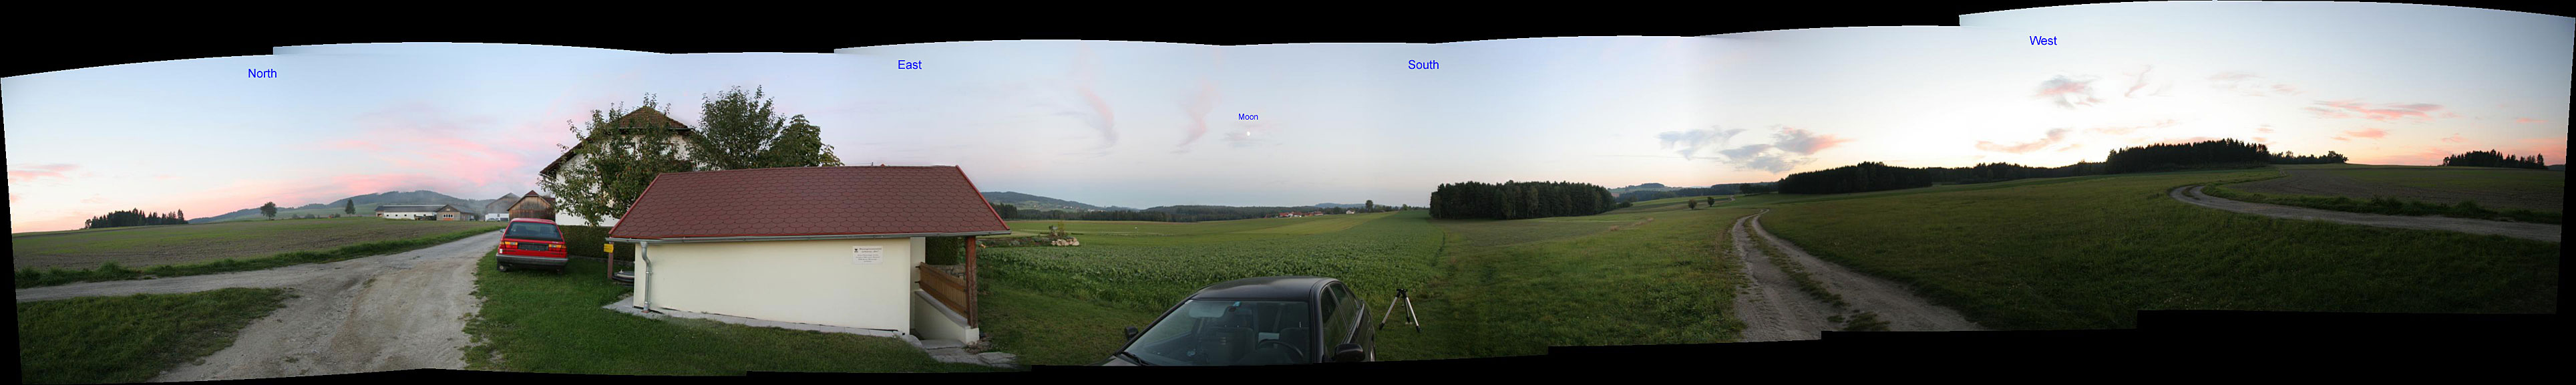
Driving the 80 kilometers from northern Woodquarter (60 km air line distance) lasted only about one hour on this Saturday evening. Although also other observation places along a line were prepared in the calculation the first planned place in Lichtenau could be used. The place was on the western limit of a housing estate on a small meadow beside the building of a water system. The setup of the equipment was done in the twilight and was finished one hour before the graze event. Because the first planned place was usable this time buffer was the result.
6. Observation and video records
Before the graze event some clouds were moving through the southern sky. But soon the clouds moved away so the observation and video recording with GPS time insertion was possible under good viewing conditions. During the graze event the star was covered twice by moon mountains as precalculated. A valley between this mountains allowed a sight of the star for about 20 seconds. So calculations, planning and this observation really brought the hoped success.
The observation place was lit in the night only by the moonlight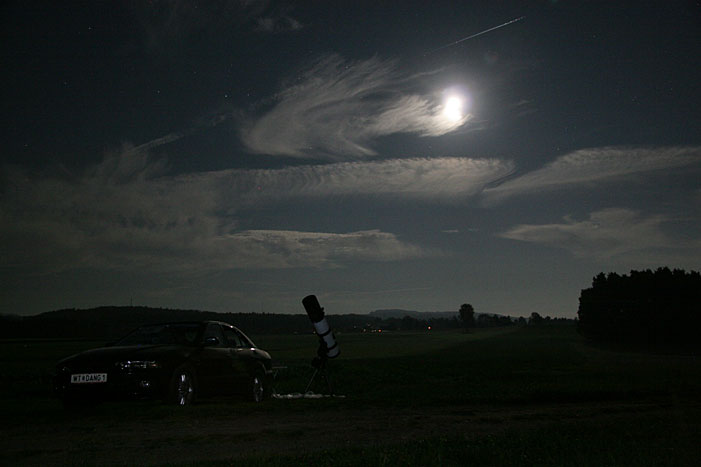
At the moment of the grazing star occultation the sky was clear again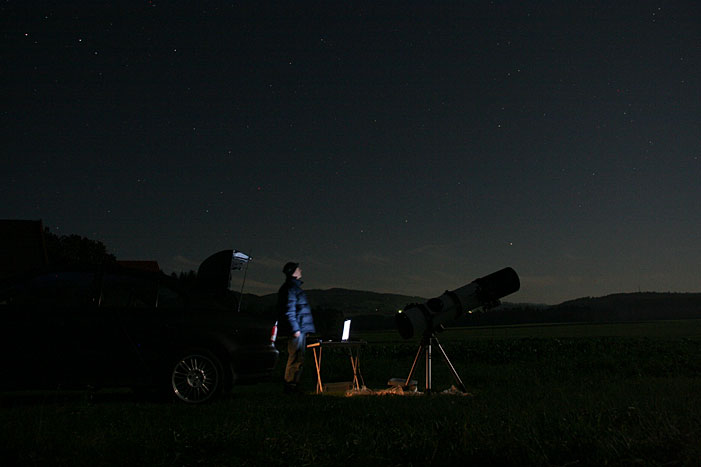
Diagram of equipment setup
Observation report

Date                         Observer Position - Lichtenau            Observer
2007/09/22                   48°  32´  56.0"  North  (WGS84)          Gerhard Dangl
Star                         14°  30´  18.3"  East   (WGS84)          3830, Nonndorf 12
ZC 3009 = SAO 189502         674.2m (MSL),    719.0m (WGS84)          AUSTRIA

TELESCOPE:
        Type: Newton
	Focal length: 1200mm
 	Aperture: 254 mm
	Magnification: video/primary focus/recorded field 1112" x 830"
	Mount: Equatorial EQ6 with EQMOD
	Motor drive: Yes

TIMING & RECORDING:
	Timekeeping: GPS 1PPS Garmin18 LVC + KIWI-OSD
        Sensor/Camera: WAT-902H2 Ultimate, CCIR, 1/2" Sony CCD-Sensor ICX419ALL
	Mode of recording: It=20ms (50 Img/s), Video CCIR, AVI, YUY2, Huffyuv,
	Device of recording: Xpert V-Stream Videograbber USB2.0, Notebook Harddisk
        Time insertion: KIWI-OSD

OBSERVING CONDITIONS:
	Atmospheric transparency: good
	Wind: No
	Star image stability: good
	Temperature: 281 Kelvin (+08 deg Celsius)

ADDITIONAL COMMENTS:
	Predictions with Occult3.6
        A total of 4 graze events (2D/2R) on the dark limb of the moon recorded
	Video evaluation accomblished with VirtualDub1.6.16 and Limovie0927
        Only clear glass filter (Astronomik) for CCD protection was used
        3-D position and timing with Garmin GPS18 LVC receiving 08 satellites
        Horizontal dilution of precision 1.1, geoidal separation 44.8m
The whole occultation process with 4 events - Click on a number shows detailed curve
Table with observed events and results of video measurement

Nr.     Date               Comment                  Video time UT             SAO       Mag
                                                    hh:mm:ss.sss   +/- s
 D1   2007/09/22     Disappearance start 100%       19:45:26.855   0.010     189502     7.4
 D1   2007/09/22     Disappearance level  50%       19:45:26.875   0.010     189502     7.4
 D1   2007/09/22     Disappearance level   0%       19:45:26.915   0.010     189502     7.4   Duration  60ms (+/-20ms)

 R1   2007/09/22     Reappearance start    0%       19:45:47.074   0.010     189502     7.4
 R1   2007/09/22     Reappearance level   50%       19:45:47.194   0.010     189502     7.4
 R1   2007/09/22     Reappearance level  100%       19:45:47.254   0.010     189502     7.4   Duration 180ms (+/-20ms)

 D2   2007/09/22     Disappearance start 100%       19:46:05.634   0.010     189502     7.4
 D2   2007/09/22     Disappearance level  50%       19:46:05.654   0.010     189502     7.4
 D2   2007/09/22     Disappearance level   0%       19:46:05.734   0.010     189502     7.4   Duration 100ms (+/-20ms)

 R2   2007/09/22     Reappearance start    0%       19:46:21.834   0.010     189502     7.4
 R2   2007/09/22     Reappearance level   50%       19:46:21.874   0.010     189502     7.4
 R2   2007/09/22     Reappearance level  100%       19:46:21.894   0.010     189502     7.4   Duration  60ms (+/-20ms)
Video measurements accomblished with software Limovie0927 from Kazuhisa Miyashita.
October 10, 2007 |
|
Site Home |