| Übersicht - alle Ereignisse | Ganzseitenversion dieser Seite |
Die Berechnung der ringförmigen Bedeckung
Year  M  D  h  m  s  Event Type     Ph   Dur dMag  %Ill   Sep  PA  MinD      h  m  s   h  m  s   h  m  s   h  m  s   h  m  s   h  m  s   h  m  s
2009 11 23 17 29 43  (II) occ (I)    A   231  0.6  57.5  54.3  69  0.036 |            17 27 48  17 29 35  17 29 43  17 29 50  17 31 38
Daten und Grafik erstellt mit Occult 4 von Dave Herald
Jupiter System - 2009/11/23
Sternkarte erstellt mit Guide 8 von Bill J Gray.
Der Aufbau für die Aufzeichnung der Bedeckung
CCIR (PAL) Vollformat Videobild 768x576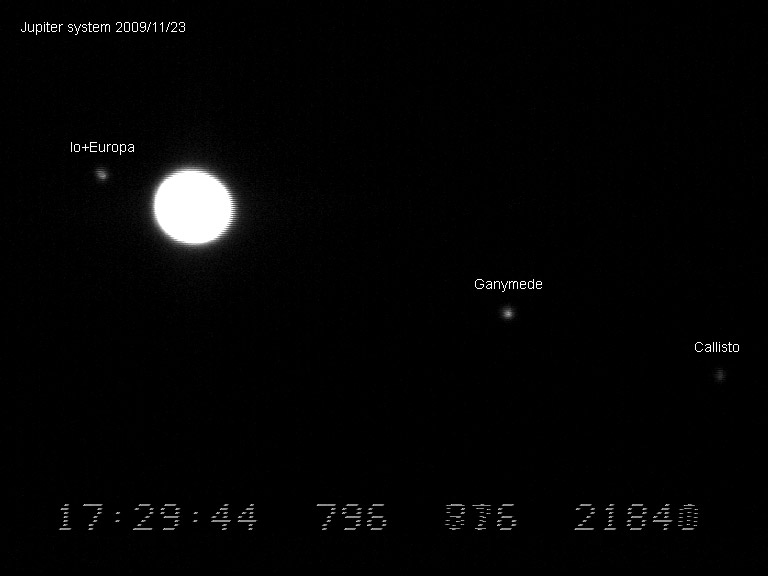
Limovie Einstellungen
MUTUAL OCCULTATION - REPORT
MUTUAL OCCULTATION - REPORT
EAON & IOTA-ES
EUROPEAN ASTEROIDAL OCCULTATION NETWORK
INTERNATIONAL OCCULTATION TIMING ASSOCIATION EUROPEAN SECTION

1.DATE: 2009/11/23
Event: Jupiter system 2O1; Europa (II) occulted Io (I)
2.OBSERVER:
Name: Gerhard Dangl
Phone: ++43-(0)2842-53908
Address: AUSTRIA, A-3830, Nonndorf 12
E-mail: gerhard@dangl.at

3.OBSERVING STATION:
Nearest city: Waidhofen/Thaya
Latitude:  N 48 47 13.3 (WGS84)
Longitude: E 15 14 06.3 (WGS84)
Altitude:  596m         (WGS84)
           552m         (MSL)
Single/Multiple: Single

4.TIMING OF EVENTS:
Type of event:
"S"tart observation; "I"nterrupt-"s"tart; "D"isappearance;
"B"link; "F"lash; "E"nd observation; "I"nterrupt-"e"nd;
"R"eappearance; "O"ther (specify)

Recording time HH:MM:SS UTC
S:    17:24:20

O:    17:29:47.9   +/- 0.1s  Occultation maximum time derived from data with  8 measurement points binning.
O:    17:29:45.7   +/- 0.3s  Occultation maximum time derived from data with 16 measurement points binning.
O:    17:29:47.0   +/- 0.6s  Occultation maximum time derived from data with 32 measurement points binning.
                             (see comments)
E:    17:35:26

5.TELESCOPE:
Type: Newton
Focal length: 1200mm + Powermate 2.5x = 3000mm effective focal length
Aperture: 254 mm
Magnification: video/primary focus/FOV 7.3'x5.5' (768x576, 0.57"x0.57" per pixel)
Mount: Equatorial
Motor drive: Yes

6.TIMING & RECORDING:
Timekeeping: GPS 1PPS Garmin 18x LVC + KIWI-OSD
Sensor/Camera: WAT-120N, CCIR, 1/2" Sony CCD-Sensor ICX419ALL, GAMMA=OFF (linear)
Mode of recording: It=40ms (25 Img/s),  Video CCIR, UYVY, Huffyuv, HFYU coded AVI,
Device of recording: TIS DFG/USB2-lt Videograbber USB2.0 (UYVY), Notebook Harddisk
Time insertion: KIWI-OSD

7.OBSERVING CONDITIONS:
Atmospheric transparency: fair but some thin clouds passing
Wind: 1 - 5m/s
Object image stability: fair
Temperature: 282 Kelvin (+09 deg Celsius)

8.ADDITIONAL COMMENTS:
Object height above local horizon at recording start: 23.8 deg
Object height above local horizon at recording end:   23.2 deg

Only Clear glass filter (Astronomik) for CCD protection was used.

Video evaluation accomplished with VirtualDub1.9.7, AviSynth2.5,
Limovie0.9.29b, LimovieAverage 1.3.0.0 beta and Excel

Occultation maximum calculation with software Peranso 2.31 using Kwee-van Woerden method

3-D Position and timing
Garmin GPS18x LVC
Receiving 08 satellites
Horizontal Dilution of Precision 1.0
Geoidal separation 44.5m (Altitude 551.5MSL + 44.5 = 596.0m in WGS84 datum)

Gerhard Dangl
gerhard@dangl.at
www.dangl.at/
Die Auswertung der Messdaten
Die Auswertung der Messdaten aus dem aufgezeichnetem Video erfolgte mit folgenden Programmen:
VirtualDub
Limovie
Avisynth
LimovieAverage
Hilfe Text, Verwendung von LimovieAverage mit mutual events
Messdaten und Ergebnisse im csv und Excel Datenformat vom 2O1 am 2009/11/23 um 17:29 UTC
Video Simulation - MPEG4 (1.41 MB)
CSV Datei, binning 8 Datenpunkte (125 KB)
Excel Datei, binning 8 Datenpunkte (581 KB)
CSV Datei, binning 16 Datenpunkte (63 KB)
Excel Datei, binning 16 Datenpunkte (403 KB)
CSV Datei, binning 32 Datenpunkte (32 KB)
Excel Datei, binning 32 Datenpunkte (315 KB)
Die Diagramme der Daten in einer Übersicht
Diagramm binning 8 Datenpunkte - Klick für volle Größe |
|
Diagramm binning 16 Datenpunkte - Klick für volle Größe |
|
Diagramm binning 32 Datenpunkte - Klick für volle Größe |
01. Dezember 2009 |
|
Zur Startseite |