Typical methodes for video recording with time insertion
Diagram 1
Video exposure time analysis
from recordings with video time insertion
Frameless version of this page
My special thanks to
David Dunham from Maryland in USA for providing a PC164C-EX2 camera. So I could make many tests and comparison measurements.
Dave Gault from Hawkesbury Heights, NSW in Australia for sending me a IOTA-VTI Demo3 video time inserter device.
Eugene Mroz from Santa Fe, NM in USA for providing his Mallincam MCH Plus Color. The Mallincam could be tested and timing was measured in several recordings.
Helmut Denzau from Panker in Germany. The first EXTA measurements on his Mintron 12V1C-EX camera, made during ESOP 2011 in Berlin - Archenhold observatory, showed me the basics about the internal exposure control of this analog video camera.
Hristo Pavlov from Sydney, Australia for timing measurements on the WAT-910BD camera and sharing the results.
Olivier Thizy from Revel in France for providing a brand new WAT-910HX/RC video camera for many measurements and comparison with previous WAT-120N.
Stefano Sposetti from Gnosca in Swiss for test recordings in 2010 with his WAT-120N+. His measurements confirmed that a WAT-120N and the newer WAT-120N+ camera are working identical in the same modes.
Terrence Redding from West Palm Beach in USA for providing two new integrating cameras. His PC165DNR and SCB2000N cameras could be tested and compared in many recordings.
Tony George from Pasco in USA, for providing a complete Canon ZR65 NTSC camcorder setup. So I could make DV recordings with several cameras and compare the recordings with DV compression with uncompressed video grabber direct harddisc recordings.
Wolfgang Rothe from Berlin in Germany for providing his Mintron 12V1C-EX video camera in summer 2012. So I could make all the exposure timing measurements with EXTA.
Without providing all this equipment, many of the measurement and test results presented on this page and on some other pages would not have been possible.
G. Dangl, November 2013
Some terms used in this page
UTC ... Universal Time Coordinated
GPS ... Global Positioning System
VTI ... Video Time Inserter
PAL ... Video colour standard using 50 fields or 25 frames per second (Phase Alternating Line)
NTSC ... Video colour standard using 59.94 fields or 29.97 frames per second (National Television Systems Committee)
CCIR ... Monochrom (B/W) version of PAL (Consultative Committee for International Radio)
EIA ... Monochrom (B/W) version of NTSC (Electronic Industries Association)
field ... two interlaced video fields, odd and even, form a complete video image also named as video frame
Odd ... first interlaced video field with odd numbered lines of a video frame counted from top as 1, 3, 5, ...
Even ... second interlaced video field with even numbered lines of a video frame counted from top as 2, 4, 6, ...
frame ... complete video image consisting of two interlaced Odd and Even video fields
Preamble
This page was primarily made for help in exposure time analysis of astronomy video records. To get results as accurate as possible we have to know about the relationship between the real exposure time in the camera and the time inserted in the analog camera output signal by the VTI device.
Video exposure, time insertion, digitizing and recording
Typical methodes for video recording with time insertion
Video Time Inserter - VTI time stamping
Example of a short star occultation with camera exposure, signal output and the VTI time stamping
The problem of combining wrong fields to frames
How to determine in which combine sequence the used video system works
The use of field delay for field combine correction
It is recommended to read all the points listed above in chronically order before the useage of any camera specific exposure and timing information below.
Timing details and diagrams for video cameras
The video cameras listed below, have been measured until now with my special EXposure Time Analyzer device EXTA. And some of them also with my special Digital Artifical Star COntrol device DASCO.
All the camera specific diagrams and time values on this page for video time evaluation are usable if the VTI device works as shown in the diagrams 2 or 3 below and if the video can be analyzed in a field to frame combining sequence A as shown in the diagram 4 below.
| Video camera type | Integration function |
| WAT-120N | Yes |
| WAT-120N+ | Yes |
| WAT-910HX | Yes |
| WAT-910BD | Yes |
| Mintron 12V1C-EX | Yes |
| PC165DNR | Yes |
| SCB-2000N | Yes |
| Mallincam MCH Plus Color | Yes |
| WAT-902H2 Ultimate | No |
| SuperCircuits PC164CEX-2 | No |
| Modul SK-1004XC/SO | No |
Typical methodes for video recording with time insertion
Diagram 1
| KIWI-OSD VTI | inserts two time stamps representing the start time of the previous field output and the start time of the current field output. | |
| inserts one time stamp representing the start time of the current field output. | ||
| IOTA VTI | inserts one time stamp representing the start time of the current field output. | |
| Cuno VTI | inserts one time stamp representing the start time of the previous field output. But the time stamp of the field before remains visible beside as an earlier time value. So always use only the later time stamp. | |
| TIM-10 VTI | inserts one time stamp representing the start time of the previous field output and one time stamp beside the letter O or E, representing the exposure start time of the current visible field. | |
| GPSBOXSPRITE3 (1 or 3 line display) | inserts a time stamp representing the start time of the current field output. | |
| GPSBOXSPRITE3 (2 or 4 line display) | inserts two time stamps representing the start time of the previous field output and the start time of the current field output. |
Example of a short star occultation with camera exposure, signal output and the VTI time stamping
The example in diagram 3 shows the typical exposure and signal output of a non integrating analog video camera without any internal delay. Immediately after the exposure end every odd or even video field signal will be transmitted at the camera output. The video field will be time stamped in the VTI with the times of the previous field. So the inserted time represents the real exposure time in the camera. I think beside the four well known Video Time Inserter mentioned above many other VTI devices are time stamping in the same way, but may be not all. So before you use the tables of this page the time stamping behaviour of the used VTI device must be well known.
One pair of an odd and an even video field are interlaced to a full video frame. If the wrong pair of fields are interlaced to a full frame the image quality will be worsen. And if this happens in a signal of an integrating video camera different integration times will be represented by the consecutive video frames. This makes the video evaluation and time analysis more difficult and inaccurate.
The problem of combining wrong fields to frames
The problem of wrong fields combined to frames is shown in diagram 4 and can occur in the recording or digitizing process. Possible reasons are the involved camera, recording hardware or the software driver. In short, all parts of the used video system. To avoid inaccurate video time evaluation the field combining behaviour of the used system should be known. While the combine error does not really affect the time evaluation of non integrated videos it can worse the time accuracy of integrated videos. With a video software like free VirtualDub the field combine behaviour of a video recording system can be determined. And with VirtualDub it can be also corrected for the video time evaluation later. This can be easy done with the use of the filter "field delay". So I would suggest to use VirtualDub for field combine correction later if needed. If a software like Limovie or Tangra is used to analyze the video file a new video file with corrected field order should be created and stored with VirtualDub.
How to determine in which combine sequence the used video system works
Here are the steps for the simple setup and test recording:
1.) Set an integrating camera to exposure over four fields or two frames. There is no need of a lens or a telescope mounted. The camera can be used on a desk with CCD front covered. But if the video image is too dark without any noise visible the cover should be opened a little bit to get some noise visible in the video.
2.) A VTI should be placed in the video output signal line as for a normal event recording. But there is no need for a GPS fix. It is only important to see the VTI field counter running and the numbers inserted in the recorded video fields.
3.) The software used for recording should be VirtualDub or an other video software with some similar features. The individual two fields of every video frame must be visible later. With VirtualDub it is possible to step frame per frame through the video and showing both fields of every frame separated but at once on a PC display. And with the use of VirtualDub it is possible to change the wrong field combine order B to the right field combine order A later if neccessary. Therefor only a special field delay filter has to be activated in VirtualDub.
4.) A short test recording of about 100 video frames should be long enough.
5.) The recorded test video must be opened again with VirtualDub. The video filter "ViewFields" has to be activated. Now it is possible to step through the video with left or right cursor buttons of the PC keypad and to see the individual fields of every frame like in diagram 5. The additional use of the filter for brightness and contrast can help to make the noise pattern better visible.
CCIR video frame with both fields visible
If a noise pattern change is visible in every frame step but only in one of the two fields, the video grabber works wrong like in the sequence B in the diagram 4 above. But if a noise change is visible only every second frame step and in both fields simultaneously the video grabber works right like in the sequence A in diagram 4. Important note, this description fits only if the integrating camera surely worked in four fields or two frames integrating during recording.
The use of field delay for field combine correction
For a recording system which is producing videos like sequence B, a special field delay setting has to be done in VirtualDub for time evaluation. But you must not use any field delay if your system works right like sequence A!
The steps for a field delay setting (sequence B only).
1.) Open the video file in VirtualDub
2.) Menue Video => Filters => Add => field delay. Select BFF to TFF or TFF to BFF. Which setting is the right one can be checked later with both fields visible. So to turn this ViewFields feature on will be the next step.
3.) Menue Video => Filters => Add => ViewFields. Now both video fields with the two field numbers of every frame are visble. If the field delay setting was right the two field numbers of a frame are consecutive without a gap between. For instance #331894 and #331895. But if the field delay setting was the wrong one, there is a gap now between the two field numbers of a frame. For instance #331896 and #331893.
4.) Write up and remember the right setting. It should be used for all videos recorded with the same video setup. But if there was a change of the camera, video digitizer, PC system or software, the digitizing sequence A or B should be determined again as described above. And in the case of working in wrong field combine sequence B the right field delay setting for correction should be determined also again.
Three demo videos showing the effects of different field combining
Video with wrong field combine sequence B. The reason for field delay corrections before time evaluation. Video sequence B with right field delay correction. Consecutive field numbers. Looks like a right sequence A now. Video sequence B with wrong field delay correction. Gap between field numbers. Must not be used.
Right click on the links above to download and save the avi video files (2.3MB) and step through the files with VirtualDub later. The three records are showing the EXTA display which was set to 1ms time resolution. Because the CCIR WAT-910HX integration time was set to mode x4 (80ms) exactly 80 LEDs from EXTA display should be lit in every integration sequence. The image contents of video #1 are 80 lit LEDs and changing only every second frame as expected. So video grabber QSonic VG310 combinates the fields in a right way. But video #2 clearly shows a wrong field combination by video grabber DFGUSB2lt. Here the contents of every frame are changing and every second frame is an overlapping frame of two integration sequences as also shown in diagram 4 above. So in this overlapping frames there are 160 LEDs lit. This is a wrong artifical image content created by the video grabber and was not exposured by the camera in this way. Video #3 is a re-record with VirtualDub of this wrong video #2. In VirtualDub the filter field delay BFF to TFF was used to get the right field combination again. So video #3 now has the right field combination and frame contents as visible in video #1 and could be used for further evaluation. To correct a wrong field combination is a fast and easy task with VirtualDub. But first of all one has to determine once if a correction is needed in the used video recording system. The way how to do this is described above.
Diagram 3
Diagram 4
Diagram 5
Video not yet corrected.
Corrected with bottom field first to top field first (BFF to TFF)
Corrected with top field first to bottom field first (TFF to BFF)

Right click on a thumbnail above to download and save the avi video file (< 0.5MB) and step through it with VirtualDub later
Video #1 with right field combination
Grabber: QSonic VG310
Software: VirtualDub
Camera: WAT910HX
Mode: X4 (80ms)Video #2 with wrong field combination
Grabber: TIS DFGUSB2lt
Software: VirtualDub
Camera: WAT910HX
Mode: X4 (80ms)Video #3 with corrected field combination
Grabber: TIS DFGUSB2lt
Software: VirtualDub
Camera: WAT910HX
Mode: X4 (80ms)
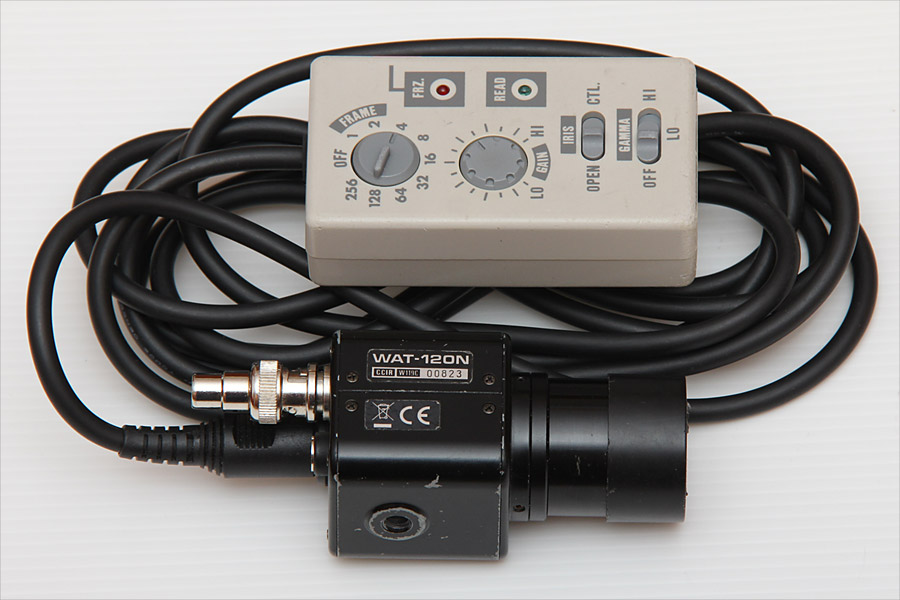 |
| WAT-120N with 1.25" Adapter and cable control box |
This integrating video camera has an internal delay.
Correction tables for selection:
Use the correction value from a table below to calculate the real event time from inserted video time. Moving throught the video in steps of fields or frames you can also select the right tolerance value.
If a WAT-120N+ camera works with shortened exposure times (High 2-6), the shortened exposure window will always be placed at the end of a video field. Because an event could have occurred or started in the unexposured part of a video field before the exposured part it may be appropriate to give correction and tolerance times in Modes High 2-6 to the same values as in Mode High 1.
Important notes:
All times used for video evaluation in step by step are assumed to be the mid time of a video field or a video frame. The only difference between working in field or frame step is that the given tolerance field is slightly different. So for this difference also two tolerance time columns are included in every correction table.
Example
WAT-120N+ (CCIR) in Mode Slow 4 (Integrating 16 video fields or 8 video frames)
Event frame VTI start time:        22:05:17.654
Event frame VTI end time:          22:05:17.694
Event frame video mid time:   Vt = 22:05:17.674
Values from the table:        It = 0.320s, Ct = -0.190s, Tolerance = ±0.170s
Real event time to report:    Rt = Vt + Ct = 22:05:17.484 (±0.170s)
Table WAT-120N (CCIR) Table WAT-120N+ (CCIR) Table WAT-120N (EIA) Table WAT-120N+ (EIA)
| WAT-120N (CCIR) | |||||
| Mode | Integration time [s] | Correction time [s] | Tolerance value [s] | ||
| Evaluation in fields (0.020s) | Evaluation in frames (0.040s) | Evaluation in fields (0.020s) | Evaluation in frames (0.040s) | ||
| Off | 0.020 | -0.040 | -0.040 | ±0.010 | ±0.020 |
| Frame 1 | 0.040 | -0.050 | -0.050 | ±0.020 | ±0.030 |
| Frame 2 | 0.080 | -0.070 | -0.070 | ±0.040 | ±0.050 |
| Frame 4 | 0.160 | -0.110 | -0.110 | ±0.080 | ±0.090 |
| Frame 8 | 0.320 | -0.190 | -0.190 | ±0.160 | ±0.170 |
| Frame 16 | 0.640 | -0.350 | -0.350 | ±0.320 | ±0.330 |
| Frame 32 | 1.280 | -0.670 | -0.670 | ±0.640 | ±0.650 |
| Frame 64 | 2.560 | -1.310 | -1.310 | ±1.280 | ±1.290 |
| Frame 128 | 5.120 | -2.590 | -2.590 | ±2.560 | ±2.570 |
| Frame 256 | 10.240 | -5.150 | -5.150 | ±5.120 | ±5.130 |
| WAT-120N+ (CCIR) | |||||
| Mode | Integration time [s] | Correction time [s] | Tolerance value [s] | ||
| Evaluation in fields (0.020s) | Evaluation in frames (0.040s) | Evaluation in fields (0.020s) | Evaluation in frames (0.040s) | ||
| High 6 | 0.0005 | -0.040 | -0.040 | ±0.010 | ±0.020 |
| High 5 | 0.001 | -0.040 | -0.040 | ±0.010 | ±0.020 |
| High 4 | 0.002 | -0.040 | -0.040 | ±0.010 | ±0.020 |
| High 3 | 0.004 | -0.040 | -0.040 | ±0.010 | ±0.020 |
| High 2 | 0.008 | -0.040 | -0.040 | ±0.010 | ±0.020 |
| High 1 | 0.020 | -0.040 | -0.040 | ±0.010 | ±0.020 |
| Slow 1 | 0.040 | -0.050 | -0.050 | ±0.020 | ±0.030 |
| Slow 2 | 0.080 | -0.070 | -0.070 | ±0.040 | ±0.050 |
| Slow 3 | 0.160 | -0.110 | -0.110 | ±0.080 | ±0.090 |
| Slow 4 | 0.320 | -0.190 | -0.190 | ±0.160 | ±0.170 |
| Slow 5 | 0.640 | -0.350 | -0.350 | ±0.320 | ±0.330 |
| Slow 6 | 1.280 | -0.670 | -0.670 | ±0.640 | ±0.650 |
| Slow 7 | 2.560 | -1.310 | -1.310 | ±1.280 | ±1.290 |
| Slow 8 | 5.120 | -2.590 | -2.590 | ±2.560 | ±2.570 |
| Slow 9 | 10.240 | -5.150 | -5.150 | ±5.120 | ±5.130 |
| WAT-120N (EIA) | |||||
| Mode | Integration time [s] | Correction time [s] | Tolerance value [s] | ||
| Evaluation in fields (0.017s) | Evaluation in frames (0.033s) | Evaluation in fields (0.017s) | Evaluation in frames (0.033s) | ||
| Off | 0.017 | -0.033 | -0.033 | ±0.008 | ±0.017 |
| Frame 1 | 0.033 | -0.042 | -0.042 | ±0.017 | ±0.025 |
| Frame 2 | 0.067 | -0.058 | -0.058 | ±0.033 | ±0.042 |
| Frame 4 | 0.134 | -0.092 | -0.092 | ±0.067 | ±0.075 |
| Frame 8 | 0.267 | -0.159 | -0.159 | ±0.134 | ±0.142 |
| Frame 16 | 0.534 | -0.292 | -0.292 | ±0.267 | ±0.275 |
| Frame 32 | 1.068 | -0.559 | -0.559 | ±0.534 | ±0.542 |
| Frame 64 | 2.136 | -1.093 | -1.093 | ±1.068 | ±1.076 |
| Frame 128 | 4.271 | -2.161 | -2.161 | ±2.136 | ±2.144 |
| Frame 256 | 8.542 | -4.296 | -4.296 | ±4.271 | ±4.279 |
| WAT-120N+ (EIA) | |||||
| Mode | Integration time [s] | Correction time [s] | Tolerance value [s] | ||
| Evaluation in fields (0.017s) | Evaluation in frames (0.033s) | Evaluation in fields (0.017s) | Evaluation in frames (0.033s) | ||
| High 6 | 0.0005 | -0.033 | -0.033 | ±0.008 | ±0.017 |
| High 5 | 0.001 | -0.033 | -0.033 | ±0.008 | ±0.017 |
| High 4 | 0.002 | -0.033 | -0.033 | ±0.008 | ±0.017 |
| High 3 | 0.004 | -0.033 | -0.033 | ±0.008 | ±0.017 |
| High 2 | 0.008 | -0.033 | -0.033 | ±0.008 | ±0.017 |
| High 1 | 0.017 | -0.033 | -0.033 | ±0.008 | ±0.017 |
| Slow 1 | 0.033 | -0.042 | -0.042 | ±0.017 | ±0.025 |
| Slow 2 | 0.067 | -0.058 | -0.058 | ±0.033 | ±0.042 |
| Slow 3 | 0.134 | -0.092 | -0.092 | ±0.067 | ±0.075 |
| Slow 4 | 0.267 | -0.159 | -0.159 | ±0.134 | ±0.142 |
| Slow 5 | 0.534 | -0.292 | -0.292 | ±0.267 | ±0.275 |
| Slow 6 | 1.068 | -0.559 | -0.559 | ±0.534 | ±0.542 |
| Slow 7 | 2.136 | -1.093 | -1.093 | ±1.068 | ±1.076 |
| Slow 8 | 4.271 | -2.161 | -2.161 | ±2.136 | ±2.144 |
| Slow 9 | 8.542 | -4.296 | -4.296 | ±4.271 | ±4.279 |
 |
|
 |
|
 |
|
 |
|
 |
|
 |
|
 |
|
 |
|
 |
|
 |
|
Video camera WAT-910HX and WAT-910BD
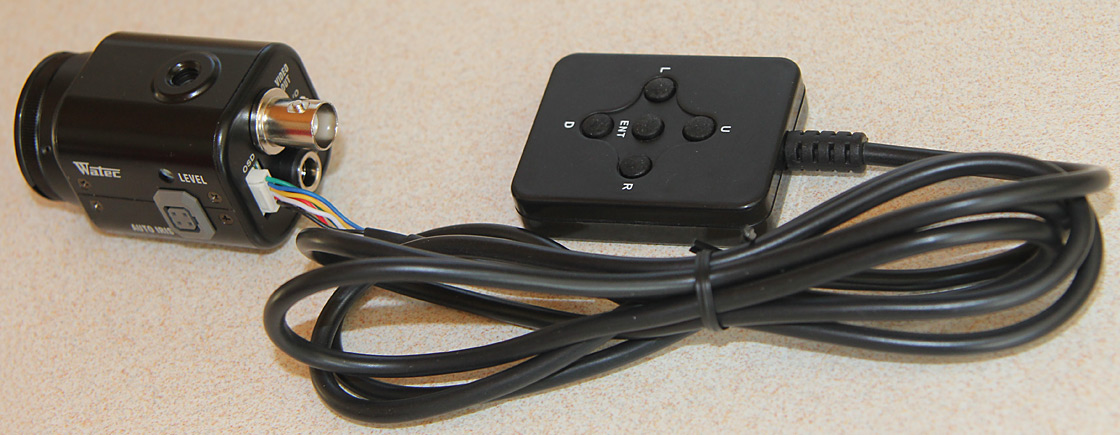 WAT-910HX/RC with cable control box |
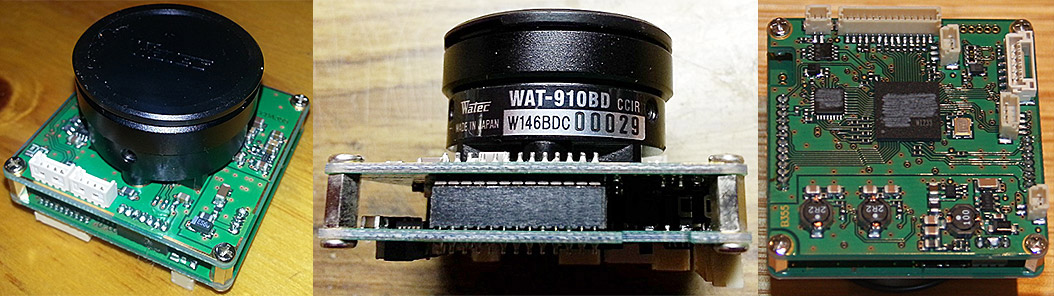 WAT-910BD version in different views |
This integrating video cameras have an internal delay.
Correction tables for selection:
Use the correction value from a table below to calculate the real event time from inserted video time. Moving throught the video in steps of fields or frames you can also select the right tolerance value.
If a WAT-910 camera works with shortened exposure times down to 10µs, the shortened exposure window will always be placed at the end of a video field. Because an event could have occurred or started in the unexposured part of a video field before the exposured part it may be appropriate to give correction and tolerance times for shortened exposure times to the same values as in normal video timing.
Important notes:
All times used for video evaluation in step by step are assumed to be the mid time of a video field or a video frame. It is important to use the right correction time and the right tolerance value working in field or in frame step evaluation.
Example
WAT-910 (CCIR) in Mode X4 (Integrating 4 video fields or 2 video frames)
Event frame VTI start time:      22:48:59.569
Event frame VTI end time:        22:48:59.609
Event frame VTI mid time:   Vt = 22:48:59.589
Values from the table:      It = 0.080s, Ct = -0.060s, Tolerance = ±0.040s
Real event time to report:  Rt = Vt + Ct = 22:48:59.529 (±0.040s)
Table WAT-910 (CCIR) Table WAT-910 (EIA)Video timing diagrams for all types of WAT-910 cameras
Download extra pdf file: Timing diagrams and tables for any WAT-910 when in use with commonly known VTIs
| WAT-910HX and WAT-910BD (CCIR) | |||||
| Mode | Integration time [s] | Correction time [s] | Tolerance value [s] | ||
| Evaluation in fields (0.020s) | Evaluation in frames (0.040s) | Evaluation in fields (0.020s) | Evaluation in frames (0.040s) | ||
| 1/50s | 0.020 | -0.020 | -0.020 | ±0.010 | ±0.020 |
| x2 | 0.040 | -0.030 | -0.040 | ±0.020 | ±0.020 |
| x4 | 0.080 | -0.050 | -0.060 | ±0.040 | ±0.040 |
| x8 | 0.160 | -0.090 | -0.100 | ±0.080 | ±0.080 |
| x16 | 0.320 | -0.170 | -0.180 | ±0.160 | ±0.160 |
| x32 | 0.640 | -0.330 | -0.340 | ±0.320 | ±0.320 |
| x64 | 1.280 | -0.650 | -0.660 | ±0.640 | ±0.640 |
| x128 | 2.560 | -1.290 | -1.300 | ±1.280 | ±1.280 |
| x256 | 5.080 | -2.550 | -2.560 | ±2.540 | ±2.540 |
Note: In the mode x256 the WAT-910 camera integrates only 254 fields or 127 frames
| WAT-910HX and WAT-910BD (EIA) | |||||
| Mode | Integration time [s] | Correction time [s] | Tolerance value [s] | ||
| Evaluation in fields (0.017s) | Evaluation in frames (0.033s) | Evaluation in fields (0.017s) | Evaluation in frames (0.033s) | ||
| 1/60s | 0.017 | -0.017 | -0.017 | ±0.008 | ±0.017 |
| x2 | 0.033 | -0.025 | -0.033 | ±0.017 | ±0.017 |
| x4 | 0.067 | -0.042 | -0.050 | ±0.033 | ±0.033 |
| x8 | 0.134 | -0.075 | -0.083 | ±0.067 | ±0.067 |
| x16 | 0.267 | -0.142 | -0.150 | ±0.134 | ±0.134 |
| x32 | 0.534 | -0.275 | -0.284 | ±0.267 | ±0.267 |
| x64 | 1.068 | -0.542 | -0.551 | ±0.534 | ±0.534 |
| x128 | 2.136 | -1.076 | -1.084 | ±1.068 | ±1.068 |
| x256 | 4.238 | -2.127 | -2.135 | ±2.119 | ±2.119 |
Note: In the mode x256 the WAT-910 camera integrates only 254 fields or 127 frames
 |
|
 |
|
 |
|
 |
|
 |
|
 |
|
 |
|
 |
|
 |
Video camera MINTRON 12V1C-EX
In my measurements with the EXTA this integrating video camera Mintron 12V1C-EX showed a quite different behaviour in comparison to the integrating video camera WAT-120N.
There is no internal additional delay between exposure end and output start like in the WAT-120N.
In all integration modes the odd and even field storages are exposured simultaneously. So all the odd and even field contents in the output signal are equal within one integration sequence.
The integration time chosen by the user in the camera OSD menue setting point "SENSE UP" is used only as a maximum value by the internal camera electronics. This camera always works in automatic mode and so makes it's own decision about the real length of an integration sequence. The real integration sequence and the real exposure length used by the camera is dependent of the recorded image brightness.
The real used integration sequence length is varied in steps of 2*n fields or n frames. But within one integration sequence the real exposure time can be additional shortened up to nearly 2 fields or one frame. In this case the real exposure has a delayed start within the integration sequence. The raw tuning of the exposure time is done in frame steps and the fine tuning is done with a delayed start (<1 frame time) in the integrating sequence.
The change of the real integration sequence length or of the real exposure duration after a setting change or an image brightness change can be very slow and so can last up to minutes until it is in a stable state.
The output of an integrated sequence always starts immediately after the end of this sequence with the next video field. There is no internal additional delay between integration sequence end and output sequence start like in a WAT-120N camera.
On dark night sky recordings with only stars in the image the camera mostly will use the maximum length from OSD menue setting for exposure. But with bright objects like a moon terminator, a planet disk or a filtered sun disk in the image, the real used exposure time could be shorter than chosen in the OSD menue setting.
Evaluation of a Mintron video recording
1.) If no integration mode was used (SENSE UP = OFF) simple report the mid time of the frame or the field where the event is visible.
2.) In all integration modes from X2 up to X128 determine the real number of recorded frames in the integration sequence during the event time. For this, one has to step through the video in single frame steps. Never trust the OSD menue "SENSE UP" setting value without a frame check of the finally recorded video.
3.) The video frame where an event is visible first is also the first frame of a new integration sequence output.
Video timing diagrams for all types of MINTRON 12V1C-EX cameras
The measured integrating analog CCIR video camera MINTRON 12V1C-EXExample
MINTRON 12V1C-EX (CCIR) in Mode X4 (Integrating 4 video fields or 2 video frames)
Event frame VTI start time: 23:56:29.593
Event frame VTI end time: 23:56:29.633
Event frame VTI mid time: Vt = 23:56:29.613
Values from the table: It = 0.080s, Ct = -0.040s, Tolerance = ±0.040s
Real event time to report: Rt = Vt + Ct = 23:56:29.573 (±0.040s)
Table MINTRON 12V1C-EX (CCIR)
Table MINTRON 12V1C-EX (EIA)
| Mintron 12V1C-EX (CCIR) | |||||
| Mode | Integration time [s] | Correction time [s] | Tolerance value [s] | ||
| Evaluation in fields (0.020s) | Evaluation in frames (0.040s) | Evaluation in fields (0.020s) | Evaluation in frames (0.040s) | ||
| OFF | 0.020 | 0 | 0 | ±0.010 | ±0.020 |
| x2 | 0.040 | -0.010 | -0.020 | ±0.020 | ±0.020 |
| x4 | 0.080 | -0.030 | -0.040 | ±0.040 | ±0.040 |
| x6 *** | 0.120 | -0.050 | -0.060 | ±0.060 | ±0.060 |
| x8 | 0.160 | -0.070 | -0.080 | ±0.080 | ±0.080 |
| x12 *** | 0.200 | -0.090 | -0.100 | ±0.100 | ±0.100 |
| x16 *** | 0.320 | -0.150 | -0.160 | ±0.160 | ±0.160 |
| x24 *** | 0.480 | -0.230 | -0.240 | ±0.240 | ±0.240 |
| x32 | 0.640 | -0.310 | -0.320 | ±0.320 | ±0.320 |
| x48 *** | 0.960 | -0.470 | -0.480 | ±0.480 | ±0.480 |
| x64 | 1.280 | -0.630 | -0.640 | ±0.640 | ±0.640 |
| x96 *** | 1.880 | -0.930 | -0.940 | ±0.940 | ±0.940 |
| x128 | 2.560 | -1.270 | -1.280 | ±1.280 | ±1.280 |
*** This red marked modes should not be used for astronomical recordings with the purpose for time or magnitude measurements. Integration time and exposure time can be different from the nominal values shown in the tables. See the timing diagrams for the details.
| Mintron 12V1C-EX (EIA) | |||||
| Mode | Integration time [s] | Correction time [s] | Tolerance value [s] | ||
| Evaluation in fields (0.017s) | Evaluation in frames (0.033s) | Evaluation in fields (0.017s) | Evaluation in frames (0.033s) | ||
| OFF | 0.017 | 0 | 0 | ±0.008 | ±0.017 |
| x2 | 0.033 | -0.008 | -0.017 | ±0.017 | ±0.017 |
| x4 | 0.067 | -0.025 | -0.033 | ±0.033 | ±0.033 |
| x6 *** | 0.100 | -0.042 | -0.050 | ±0.050 | ±0.050 |
| x8 | 0.134 | -0.058 | -0.067 | ±0.067 | ±0.067 |
| x12 *** | 0.167 | -0.075 | -0.083 | ±0.083 | ±0.083 |
| x16 *** | 0.267 | -0.125 | -0.134 | ±0.134 | ±0.134 |
| x24 *** | 0.400 | -0.192 | -0.200 | ±0.200 | ±0.200 |
| x32 | 0.534 | -0.259 | -0.267 | ±0.267 | ±0.267 |
| x48 *** | 0.801 | -0.392 | -0.400 | ±0.400 | ±0.400 |
| x64 | 1.068 | -0.526 | -0.534 | ±0.534 | ±0.534 |
| x96 *** | 1.568 | -0.776 | -0.784 | ±0.784 | ±0.784 |
| x128 | 2.135 | -1.059 | -1.068 | ±1.068 | ±1.068 |
*** This red marked modes should not be used for astronomical recordings with the purpose for time or magnitude measurements. Integration time and exposure time can be different from the nominal values shown in the tables. See the timing diagrams for the details.
 |
|
 |
|
 |
|
 |
|
 |
|
 |
|
 |
|
 |
|
 |
|
 |
|
 |
|
|
 |
 |
This integrating video camera has an internal delay.
Correction tables for selection:
Use the correction value from a table below to calculate the real event time from inserted video time. Moving throught the video in steps of fields or frames you can also select the right tolerance value.
If a PC165DNR camera works with shortened exposure times down to 10µs, the shortened exposure window will always be placed at the end of a video field. Because an event could have occurred or started in the unexposured part of a video field before the exposured part it may be appropriate to give correction and tolerance times for shortened exposure times to the same values as in normal video timing.
Important notes:
All times used for video evaluation in step by step are assumed to be the mid time of a video field or a video frame. It is important to use the right correction time and the right tolerance value working in field or in frame step evaluation.
Example
PC165DNR (EIA) in Mode X8 (Integrating 8 video fields or 4 video frames)
Event frame VTI start time:      23:48:46.737
Event frame VTI end time:        22:48:46.770
Event frame VTI mid time:   Vt = 22:48:46.753
Values from the table:      It = 0.134s, Ct = -0.083s, Tolerance = ±0.067s
Real event time to report:  Rt = Vt + Ct = 22:48:46.670 (±0.067s)
Table PC165DNR (EIA)
| PC165DNR (EIA) | |||||
| Mode | Integration time [s] | Correction time [s] | Tolerance value [s] | ||
| Evaluation in fields (0.017s) | Evaluation in frames (0.033s) | Evaluation in fields (0.017s) | Evaluation in frames (0.033s) | ||
| 1/60s | 0.017 | -0.017 | -0.017 | ±0.008 | ±0.017 |
| x2 | 0.033 | -0.025 | -0.033 | ±0.017 | ±0.017 |
| x4 | 0.067 | -0.042 | -0.050 | ±0.033 | ±0.033 |
| x8 | 0.134 | -0.075 | -0.083 | ±0.067 | ±0.067 |
| x16 | 0.267 | -0.142 | -0.150 | ±0.134 | ±0.134 |
| x32 | 0.534 | -0.275 | -0.284 | ±0.267 | ±0.267 |
| x64 | 1.068 | -0.542 | -0.551 | ±0.534 | ±0.534 |
| x128 | 2.136 | -1.076 | -1.084 | ±1.068 | ±1.068 |
| x256 | 4.271 | -2.144 | -2.152 | ±2.136 | ±2.136 |
 |
|
 |
|
 |
|
 |
|
 |
|
 |
|
 |
|
 |
|
 |
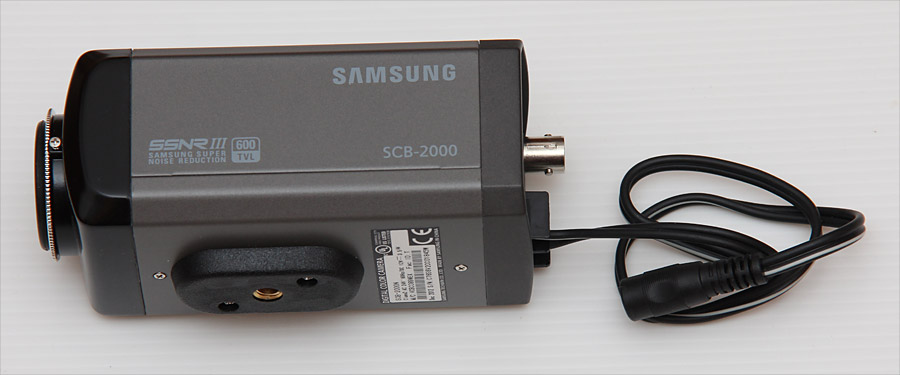 |
This integrating video camera has an internal delay.
Correction tables for selection:
Use the correction value from a table below to calculate the real event time from inserted video time. Moving throught the video in steps of fields or frames you can also select the right tolerance value.
If a SCB-2000N camera works with shortened exposure times down to 10µs, the shortened exposure window will always be placed at the end of a video field. Because an event could have occurred or started in the unexposured part of a video field before the exposured part it may be appropriate to give correction and tolerance times for shortened exposure times to the same values as in normal video timing.
The integration time chosen by the user in the camera OSD menue setting point "SENSE UP" is used only as a maximum value by the internal camera electronics. This camera always works in automatic mode and so makes it's own decision about the real length of an integration sequence. The real integration sequence and the real exposure length used by the camera is dependent of the recorded image brightness.
The change of the real integration sequence length after a setting change or an image brightness change can be very slow and so can last up to minutes until it is in a stable state. This behaviour has also been previously observed in the Mintron.
Important notes:
All times used for video evaluation in step by step are assumed to be the mid time of a video field or a video frame. It is important to use the right correction time and the right tolerance value working in field or in frame step evaluation.
Example
SCB2000N (EIA) in Mode X8 (Integrating 8 video fields or 4 video frames)
Event frame VTI start time:      01:20:54.606
Event frame VTI end time:        01:20:54.640
Event frame VTI mid time:   Vt = 01:20:54.623
Values from the table:      It = 0.134s, Ct = -0.100s, Tolerance = ±0.067s
Real event time to report:  Rt = Vt + Ct = 01:20:54.523 (±0.067s)
Table SCB-2000N (EIA)
| SCB-2000N (EIA) | |||||
| Mode | Integration time [s] | Correction time [s] | Tolerance value [s] | ||
| Evaluation in fields (0.017s) | Evaluation in frames (0.033s) | Evaluation in fields (0.017s) | Evaluation in frames (0.033s) | ||
| 1/60s | 0.017 | -0.033 | -0.033 | ±0.008 | ±0.017 |
| x2 | 0.033 | -0.042 | -0.050 | ±0.017 | ±0.017 |
| x4 | 0.067 | -0.058 | -0.067 | ±0.033 | ±0.033 |
| x6 | 0.100 | -0.075 | -0.083 | ±0.050 | ±0.050 |
| x8 | 0.134 | -0.092 | -0.100 | ±0.067 | ±0.067 |
| x10 | 0.167 | -0.108 | -0.117 | ±0.083 | ±0.083 |
| x12 | 0.200 | -0.125 | -0.134 | ±0.100 | ±0.100 |
| x14 | 0.234 | -0.142 | -0.150 | ±0.117 | ±0.117 |
| x16 | 0.267 | -0.159 | -0.167 | ±0.134 | ±0.134 |
| x24 | 0.400 | -0.225 | -0.234 | ±0.200 | ±0.200 |
| x32 | 0.534 | -0.292 | -0.300 | ±0.267 | ±0.267 |
| x64 | 1.068 | -0.559 | -0.567 | ±0.534 | ±0.534 |
| x128 | 2.136 | -1.093 | -1.101 | ±1.068 | ±1.068 |
| x256 | 4.271 | -2.161 | -2.169 | ±2.136 | ±2.136 |
| x512 | 8.542 | -4.296 | -4.304 | ±4.271 | ±4.271 |
 |
|
 |
|
 |
|
 |
|
 |
|
 |
|
 |
|
 |
|
 |
|
 |
|
 |
|
 |
|
 |
|
 |
|
 |
|
Video camera Mallincam MCH Plus Color
In my measurements with EXTA this integrating video camera Mallincam MCH Plus Color showed a similar behaviour like the integrating video camera MINTRON 12V1C-EX. The only timing difference between this two cameras is one additional field time delay in the Mallincam between exposure end and signal output.
In all integration modes the odd and even field storages are exposured simultaneously. So all the odd and even field contents in the output signal are equal within one integration sequence.
The integration time chosen by the user in the camera OSD menue setting point "SENSE UP" is used only as a maximum value by the internal camera electronics. This camera always works in automatic mode and so makes it's own decision about the real length of an integration sequence. The real integration sequence and the real exposure length used by the camera is dependent of the recorded image brightness.
The change of the real integration sequence length or of the real exposure duration after a setting change or an image brightness change can be very slow and so can last up to minutes until it is in a stable state.
The output of an integrated sequence always starts with one field time delay after the end of this sequence.
On dark night sky recordings with only stars in the image the camera mostly will use the maximum length from OSD menue setting for exposure. But with bright objects like a moon terminator, a planet disk or a filtered sun disk in the image, the real used exposure time could be shorter than chosen in the OSD menue setting.
Evaluation of a Mallincam video recording
1.) If no integration mode was used (SENSE UP = OFF) subtract one field time from the mid time of the frame or the field where the event is visible first and report this time as event time.
2.) In all integration modes from X2 up to X128 determine the real number of recorded frames in the integration sequence during the event time. For this, one has to step through the video in single frame steps. Never trust the OSD menue "SENSE UP" setting value without a frame check of the finally recorded video.
3.) The video frame where an event is visible first is also the first frame of a new integration sequence output.
Video timing diagrams for all types of Mallincam MCH Plus Color cameras
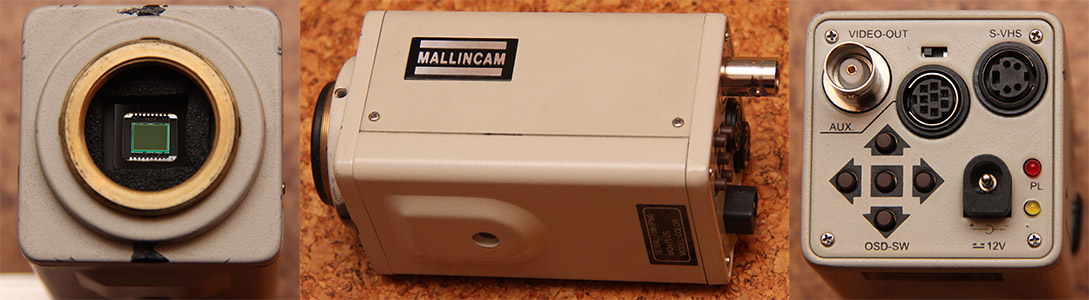
The measured integrating analog EIA video camera Mallincam MCH Plus ColorExample
Mallincam MCH Plus Color (EIA) in Mode X4 (Integrating 4 video fields or 2 video frames)
Event frame VTI start time: 23:44:24.521
Event frame VTI end time: 23:44:24.554
Event frame VTI mid time: Vt = 23:44:24.538
Values from the table: It = 0.067s, Ct = -0.050s, Tolerance = ±0.033s
Real event time to report: Rt = Vt + Ct = 23:44:24.488 (±0.033s)
Table Mallincam MCH Plus Color (CCIR)
Table Mallincam MCH Plus Color (EIA)
| Mallincam MCH Plus Color (CCIR) | |||||
| Mode | Integration time [s] | Correction time [s] | Tolerance value [s] | ||
| Evaluation in fields (0.020s) | Evaluation in frames (0.040s) | Evaluation in fields (0.020s) | Evaluation in frames (0.040s) | ||
| OFF | 0.020 | -0.020 | -0.020 | ±0.010 | ±0.020 |
| x2 | 0.040 | -0.030 | -0.040 | ±0.020 | ±0.020 |
| x4 | 0.080 | -0.050 | -0.060 | ±0.040 | ±0.040 |
| x6 *** | 0.120 | -0.070 | -0.080 | ±0.060 | ±0.060 |
| x8 | 0.160 | -0.090 | -0.100 | ±0.080 | ±0.080 |
| x12 *** | 0.200 | -0.110 | -0.120 | ±0.100 | ±0.100 |
| x16 | 0.320 | -0.170 | -0.180 | ±0.160 | ±0.160 |
| x24 *** | 0.480 | -0.250 | -0.260 | ±0.240 | ±0.240 |
| x32 | 0.640 | -0.330 | -0.340 | ±0.320 | ±0.320 |
| x48 *** | 0.960 | -0.490 | -0.500 | ±0.480 | ±0.480 |
| x64 | 1.280 | -0.650 | -0.660 | ±0.640 | ±0.640 |
| x96 *** | 1.880 | -0.950 | -0.960 | ±0.940 | ±0.940 |
| x128 | 2.560 | -1.290 | -1.300 | ±1.280 | ±1.280 |
*** This red marked modes should not be used for astronomical recordings with the purpose for time or magnitude measurements. Integration time and exposure time can be different from the nominal values shown in the tables. See the timing diagrams for the details.
| Mallincam MCH Plus Color (EIA) | |||||
| Mode | Integration time [s] | Correction time [s] | Tolerance value [s] | ||
| Evaluation in fields (0.017s) | Evaluation in frames (0.033s) | Evaluation in fields (0.017s) | Evaluation in frames (0.033s) | ||
| OFF | 0.017 | -0.017 | -0.017 | ±0.008 | ±0.017 |
| x2 | 0.033 | -0.025 | -0.033 | ±0.017 | ±0.017 |
| x4 | 0.067 | -0.042 | -0.050 | ±0.033 | ±0.033 |
| x6 *** | 0.100 | -0.058 | -0.067 | ±0.050 | ±0.050 |
| x8 | 0.134 | -0.075 | -0.083 | ±0.067 | ±0.067 |
| x12 *** | 0.167 | -0.092 | -0.100 | ±0.083 | ±0.083 |
| x16 | 0.267 | -0.142 | -0.150 | ±0.134 | ±0.134 |
| x24 *** | 0.400 | -0.209 | -0.217 | ±0.200 | ±0.200 |
| x32 | 0.534 | -0.275 | -0.284 | ±0.267 | ±0.267 |
| x48 *** | 0.801 | -0.409 | -0.417 | ±0.400 | ±0.400 |
| x64 | 1.068 | -0.542 | -0.551 | ±0.534 | ±0.534 |
| x96 *** | 1.568 | -0.793 | -0.801 | ±0.784 | ±0.784 |
| x128 | 2.135 | -1.076 | -1.084 | ±1.068 | ±1.068 |
*** This red marked modes should not be used for astronomical recordings with the purpose for time or magnitude measurements. Integration time and exposure time can be different from the nominal values shown in the tables. See the timing diagrams for the details.
 |
|
 |
|
 |
|
 |
|
 |
|
 |
|
 |
|
 |
|
 |
|
 |
|
 |
|
|
 |
Video camera WAT-902H2 Ultimate
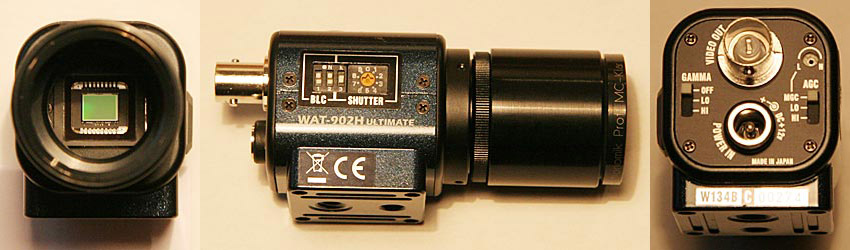 |
No internal delay in this video camera.
In electronic shutter mode OFF the two KIWI-OSD timestampes in the video fields on output specify exactly the start and the end of optical exposure time in this video field. As in most video cameras a time shift between exposure window and V-sync signal of around 0.84 millisecond exists (value determined with VEXA). But no correction of time is necessary because inserted time is equal to the time of optical event +/- 1ms.
In electronic shutter ON/Mode 0-7 exposure times can be set to different shorter values. If working with shortened exposure times it is possible that a short event is missed by the video camera.
In electronic shutter ON/Mode 8-9 exposure time is automatic controlled. Because the exact exposure time is unknown we have always to assume and use the longest possible exposure time with the largest tolerance value. If camera is working in automatic controll with shortened exposure times it is possible that a short event is missed by the video camera.
If a WAT-902H2 Ultimate camera works with shortened exposure times (ON/0-9), the shortened exposure window will always be placed at the end of a video field. Because an event could have occurred or started in the unexposured part of a video field before the exposured part it may be appropriate to give tolerance times in Modes ON/0-9 to the same values as in Mode OFF.
Important notes:
All times used for video evaluation in step by step are assumed to be the mid time of a video field or a video frame. The only difference between working in field or frame step is that the given tolerance has to be expanded by one video field time if frame timing is used. So for this difference two tolerance time columns are included in every correction table.
Example
WAT-902H2 Ultimate (EIA) in Mode Off (normal timing)
Event frame VTI start time:        17:38:09.243
Event frame VTI end time:          17:38:09.276
Event frame video mid time:   Vt = 17:38:09.260
Values from the table:        It = 0.017s, Ct = 0s, Tolerance = ±0.017s
Real event time to report:    Rt = Vt + Ct = 17:38:09.260 (±0.017s)
Table WAT-902H2 Ultimate (CCIR) Table WAT-902H2 Ultimate (EIA)Video timing diagrams for all types of WAT-902H2 Ultimate cameras
| WAT-902H2 Ultimate (CCIR) | |||||
| Mode | Integration time [s] | Correction time [s] | Tolerance value [s] | ||
| Evaluation in fields (0.020s) | Evaluation in frames (0.040s) | Evaluation in fields (0.020s) | Evaluation in frames (0.040s) | ||
| Off | 0.020 | 0 | 0 | ±0.010 | ±0.020 |
| ON/0 | 0.008 | 0 | 0 | ±0.010 | ±0.020 |
| ON/1 | 0.004 | 0 | 0 | ±0.010 | ±0.020 |
| ON/2 | 0.002 | 0 | 0 | ±0.010 | ±0.020 |
| ON/3 | 0.001 | 0 | 0 | ±0.010 | ±0.020 |
| ON/4 | 500 µs | 0 | 0 | ±0.010 | ±0.020 |
| ON/5 | 200 µs | 0 | 0 | ±0.010 | ±0.020 |
| ON/6 | 100 µs | 0 | 0 | ±0.010 | ±0.020 |
| ON/7 | 10 µs | 0 | 0 | ±0.010 | ±0.020 |
| ON/8 | 10 µs - 20ms | 0 | 0 | ±0.010 | ±0.020 |
| ON/9 | 10 µs - 8ms | 0 | 0 | ±0.010 | ±0.020 |
| WAT-902H2 Ultimate (EIA) | |||||
| Mode | Integration time [s] | Correction time [s] | Tolerance value [s] | ||
| Evaluation in fields (0.017s) | Evaluation in frames (0.033s) | Evaluation in fields (0.017s) | Evaluation in frames (0.033s) | ||
| Off | 0.017 | 0 | 0 | ±0.008 | ±0.017 |
| ON/0 | 0.008 | 0 | 0 | ±0.008 | ±0.017 |
| ON/1 | 0.004 | 0 | 0 | ±0.008 | ±0.017 |
| ON/2 | 0.002 | 0 | 0 | ±0.008 | ±0.017 |
| ON/3 | 0.001 | 0 | 0 | ±0.008 | ±0.017 |
| ON/4 | 500 µs | 0 | 0 | ±0.008 | ±0.017 |
| ON/5 | 200 µs | 0 | 0 | ±0.008 | ±0.017 |
| ON/6 | 100 µs | 0 | 0 | ±0.008 | ±0.017 |
| ON/7 | 10 µs | 0 | 0 | ±0.008 | ±0.017 |
| ON/8 | 10 µs - 17ms | 0 | 0 | ±0.008 | ±0.017 |
| ON/9 | 10 µs - 10ms | 0 | 0 | ±0.008 | ±0.017 |
 |
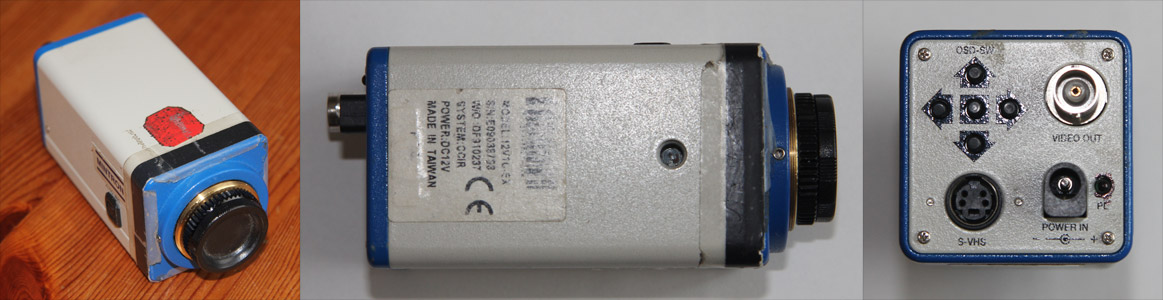
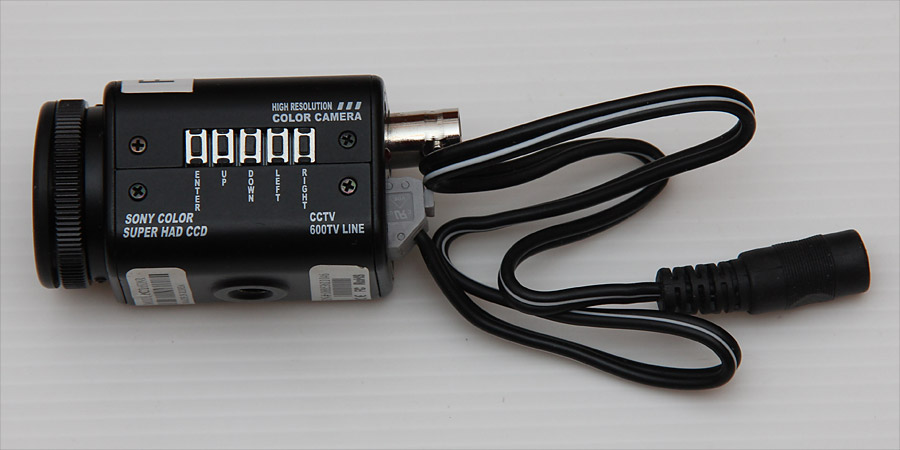
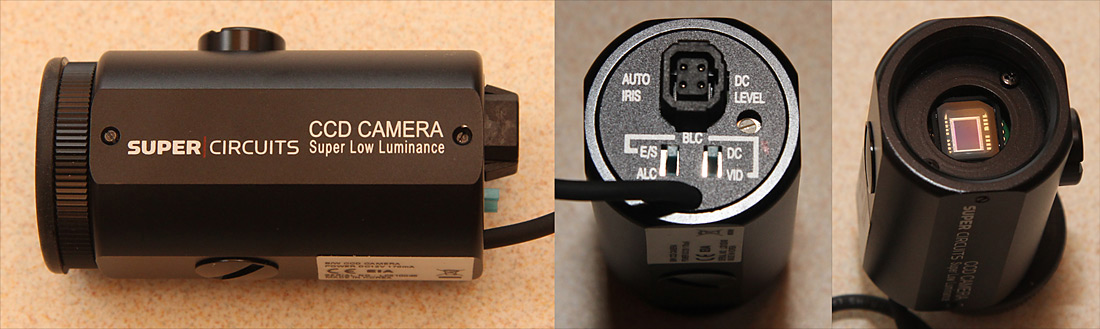
Video camera PC164C-EX2
No internal delay in this video camera.
In this video camera the exposure time is automatic controlled in the range of 10µs to 16.7ms. In typical astronomical night recordings the longest exposure time of 16.7ms can be assumed. And because the exact exposure time is unknown we have always to assume and use the longest possible exposure time with the largest tolerance value. If working with shortened exposure times on bright image contents this camera starts optical exposure delayed in every video field. So in this case it would be possible that a very short event is missed by the video camera.
EIA
The two KIWI-OSD timestampes in the video fields on output specify exactly the start and the end time of the video fields in which the optical exposures occured. And the time inserted by the IOTA-VTI device shows the exposure end time of every video field as expected.
Example
PC164C-EX2 (EIA)
Event frame VTI start time:        23:08:57.104
Event frame VTI end time:          23:08:57.137
Event field video mid time:   Vt = 23:08:57.121
Values from the table:        It = 0.034s, Ct = 0s, Tolerance = ±0.017s
Real event time to report:    Rt = Vt + Ct = 23:08:57.121 (±0.017s)
Table PC164C-EX2 (EIA)
| Video camera PC164C-EX2 (EIA) | |||||
| Mode | Integration time [s] | Correction time [s] | Tolerance value [s] | ||
| Evaluation in fields (0.017s) | Evaluation in frames (0.033s) | Evaluation in fields (0.017s) | Evaluation in frames (0.033s) | ||
| Automatic | 0.00001 - 0.0167 | 0 | 0 | ±0.008 | ±0.017 |
 |
Video camera modul SK-1004XC/SO
No internal delay in this video modul.
In this video camera modul the exposure time is automatic controlled in the range of 10µs to 20ms. Because the exact exposure time is unknown we have always to assume and use the longest possible exposure time with the largest tolerance value. If working with shortened exposure times it is possible that a short event is missed by the video camera modul.
CCIR
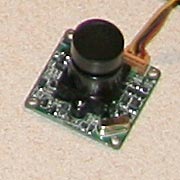
The two KIWI-OSD timestampes in the video fields on output specify exactly the start and the end of optical exposure time in this video field. As in most video cameras a time shift between exposure window and V-sync signal of around 0.76 millisecond exists (value determined with VEXA). But no correction of time is necessary because inserted time is equal to the time of optical event +/- 1ms. The video timing of this video module, runs a little bit too slow, for the first three seconds after power ON.
Example
SK-1004XC/SO (CCIR)
Event frame VTI start time:        20:07:44.038
Event frame VTI end time:          20:07:44.078
Event field video mid time:   Vt = 20:07:44.058
Values from the table:        It = 0.040s, Ct = 0s, Tolerance = ±0.020s
Real event time to report:    Rt = Vt + Ct = 20:07:44.058 (±0.020s)
Table Modul SK-1004X (CCIR)
| Video camera modul SK-1004XC (CCIR) | |||||
| Mode | Integration time [s] | Correction time [s] | Tolerance value [s] | ||
| Evaluation in fields (0.020s) | Evaluation in frames (0.040s) | Evaluation in fields (0.020s) | Evaluation in frames (0.040s) | ||
| Automatic | 0.00001 - 0.020 | 0 | 0 | ±0.010 | ±0.020 |
 |
March 27, 2024 |
|
Site Home |